Soil Slope Reinforcement Using Geomembrane, Geocomposite, and Geogrid Materials
Slope without Facing:
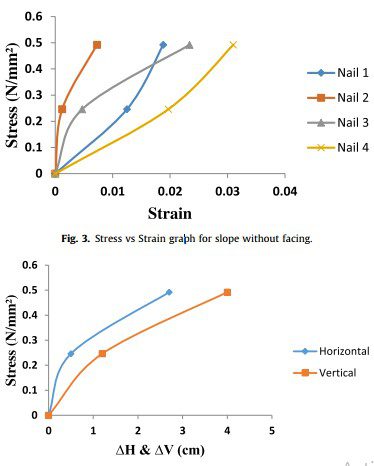
The slope without facing failed at a stress of 0.492 kN/m, showing horizontal displacement of 2.7 cm and vertical displacement of 4 cm. Figure 1 illustrates the stress-strain curve and corresponding horizontal and vertical displacements.
Slope with Geomembrane Facing:
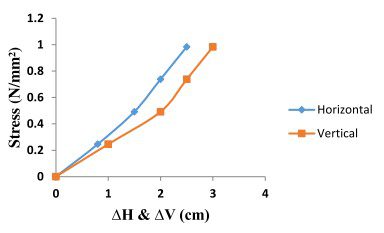
The slope reinforced with geomembrane facing failed at 0.984 kN/m stress, showing horizontal displacement of 2.5 cm and vertical displacement of 3 cm. Figure 2 shows the related stress-strain and displacement curves.
Slope with Geocomposite Facing:
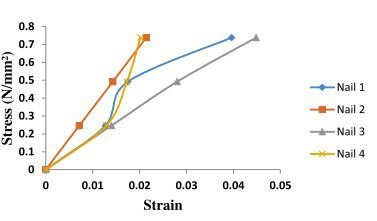
The slope with geocomposite facing failed at 1.23 kN/m stress, with horizontal displacement of 2 cm and vertical displacement of 3.5 cm. Figure 3 illustrates the respective curves.
Slope with Biaxial Geogrid Facing:
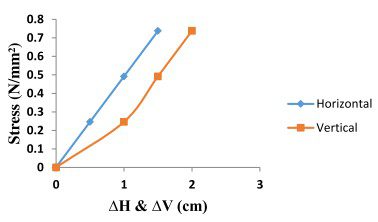
The slope with biaxial geogrid facing failed at 0.738 kN/m stress, showing horizontal displacement of 1.5 cm and vertical displacement of 2 cm. Figure 4 presents the related curves.
Horizontal Displacement:
The materials (geomembrane, geocomposite, biaxial geogrid) demonstrate good tensile strength with smaller vertical and horizontal displacements under loading. The maximum horizontal displacement occurred in the slope without facing (2.7 cm at 0.492 N/mm²). For slopes with reinforcement, horizontal displacements were 2.5 cm for geomembrane at 0.984 MPa, 1.5 cm for biaxial geogrid at 0.738 N/mm², and 2 cm for geocomposite at 1.23 N/mm².
Geocomposite shows the highest strength, making it an excellent facing material with a maximum horizontal displacement of 2 cm at 1.23 N/mm².
Vertical Displacement:
Vertical displacements were compared for slopes with and without facing. The maximum vertical displacement occurred in the slope without facing (4 cm at 0.492 N/mm²). Slopes with geocomposite facing showed 3.5 cm at 1.23 N/mm², biaxial geogrid facing 2 cm at 0.738 N/mm², and geomembrane facing 3 cm at 0.984 N/mm².